Book a demo

Networking

From the application to the switch port, in one view.

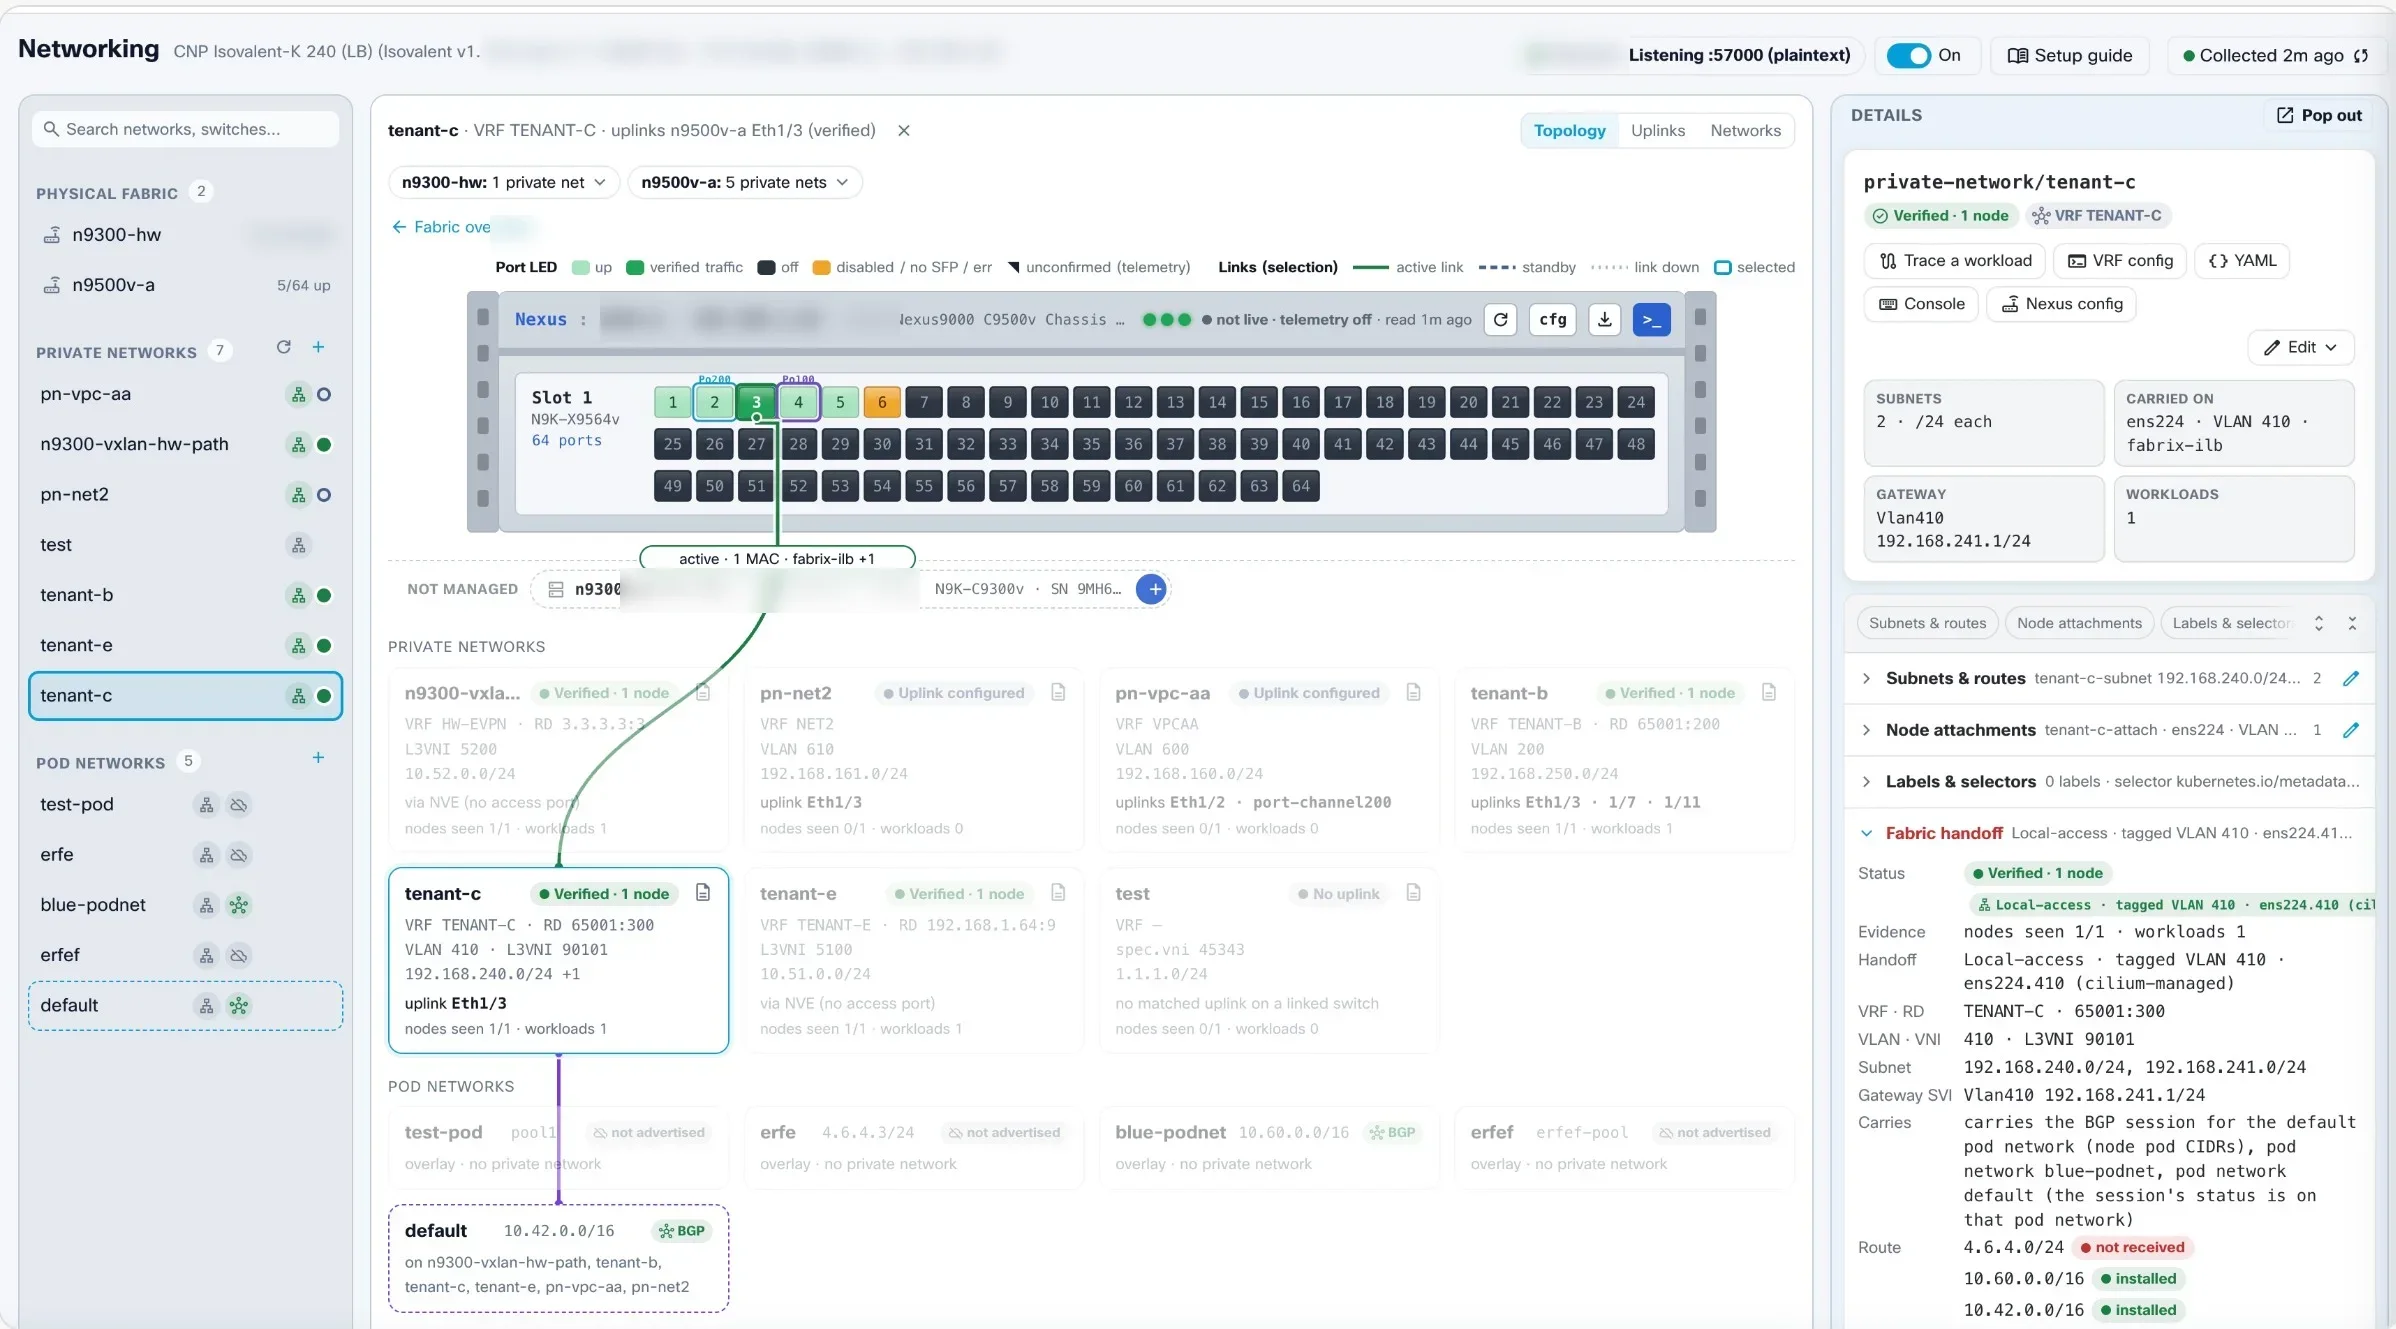
The pod network, private network, VRF, VLAN and VNI, and the exact Nexus port, shown as one verified path. Provision private networks and propose switch config from the same console.

Fabrix Networking: a Nexus 9000 faceplate with port LEDs, private networks with VRF, VLAN and VNI, the path from a pod network to a switch port, and a details rail with the fabric handoff

Networking in the console

For you
Off-menu
TopologyLive map of every workload, with Hubble flows on the edges.
Live flows: forwarded / droppedCreate Allow/Deny policy prefilled from this flowStack layers down to the Physical Underlay
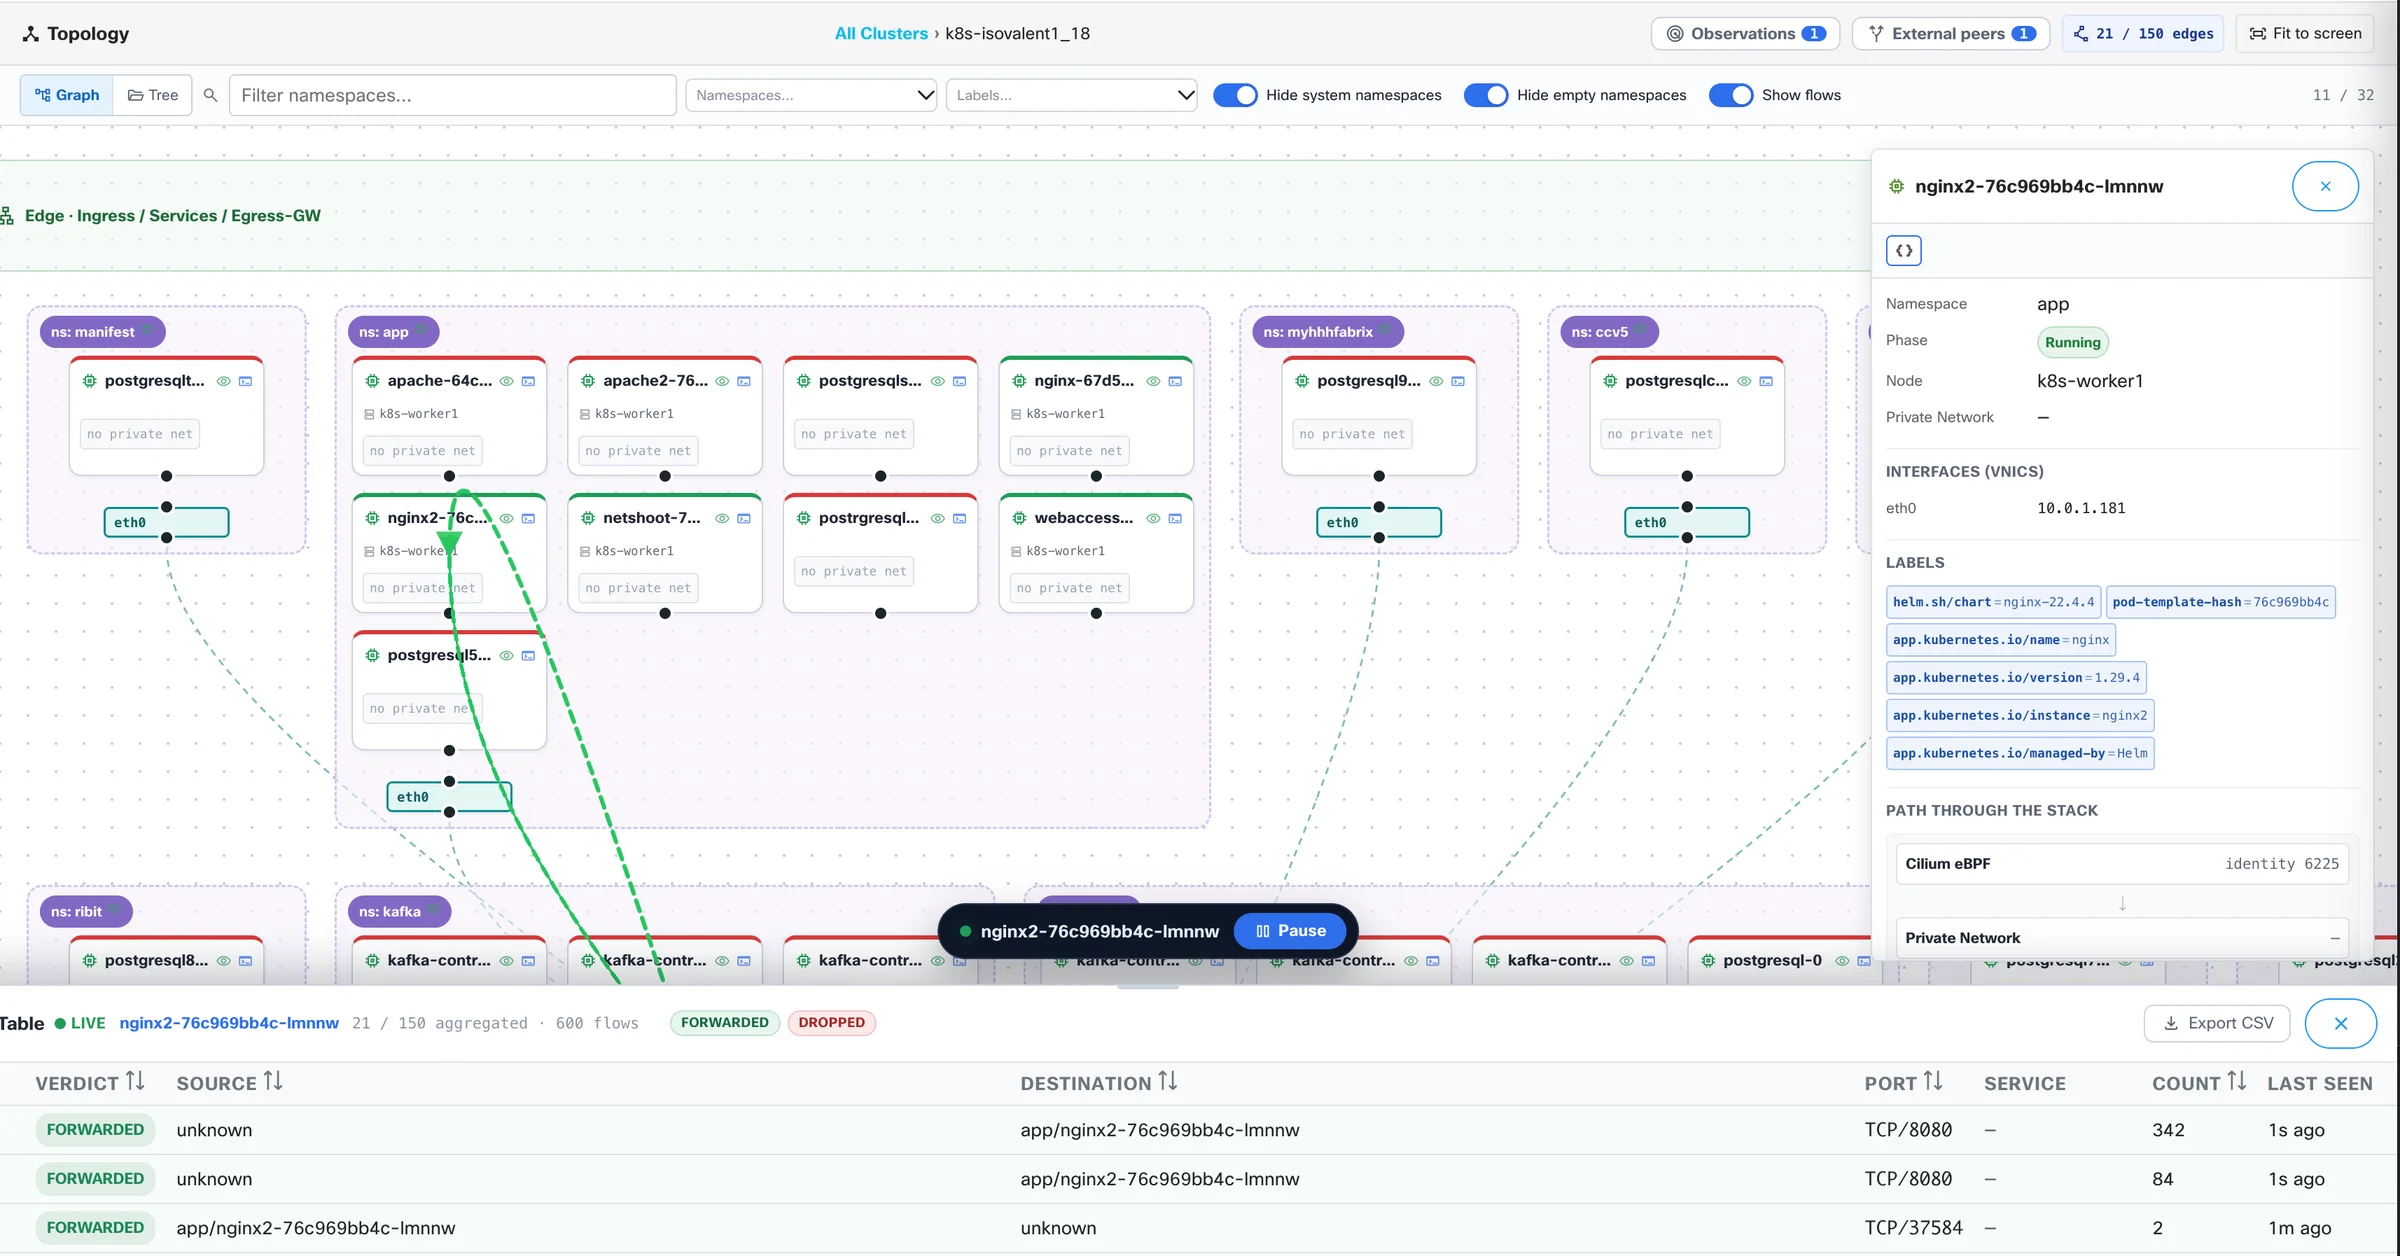
Fabrix Topology: workloads grouped by namespace with a live Hubble flow drawn as a green dashed edge, a node inspector, and a flow table of FORWARDED verdicts
For you
Local
NetworkingPhysical + overlay networking, authored and traced.
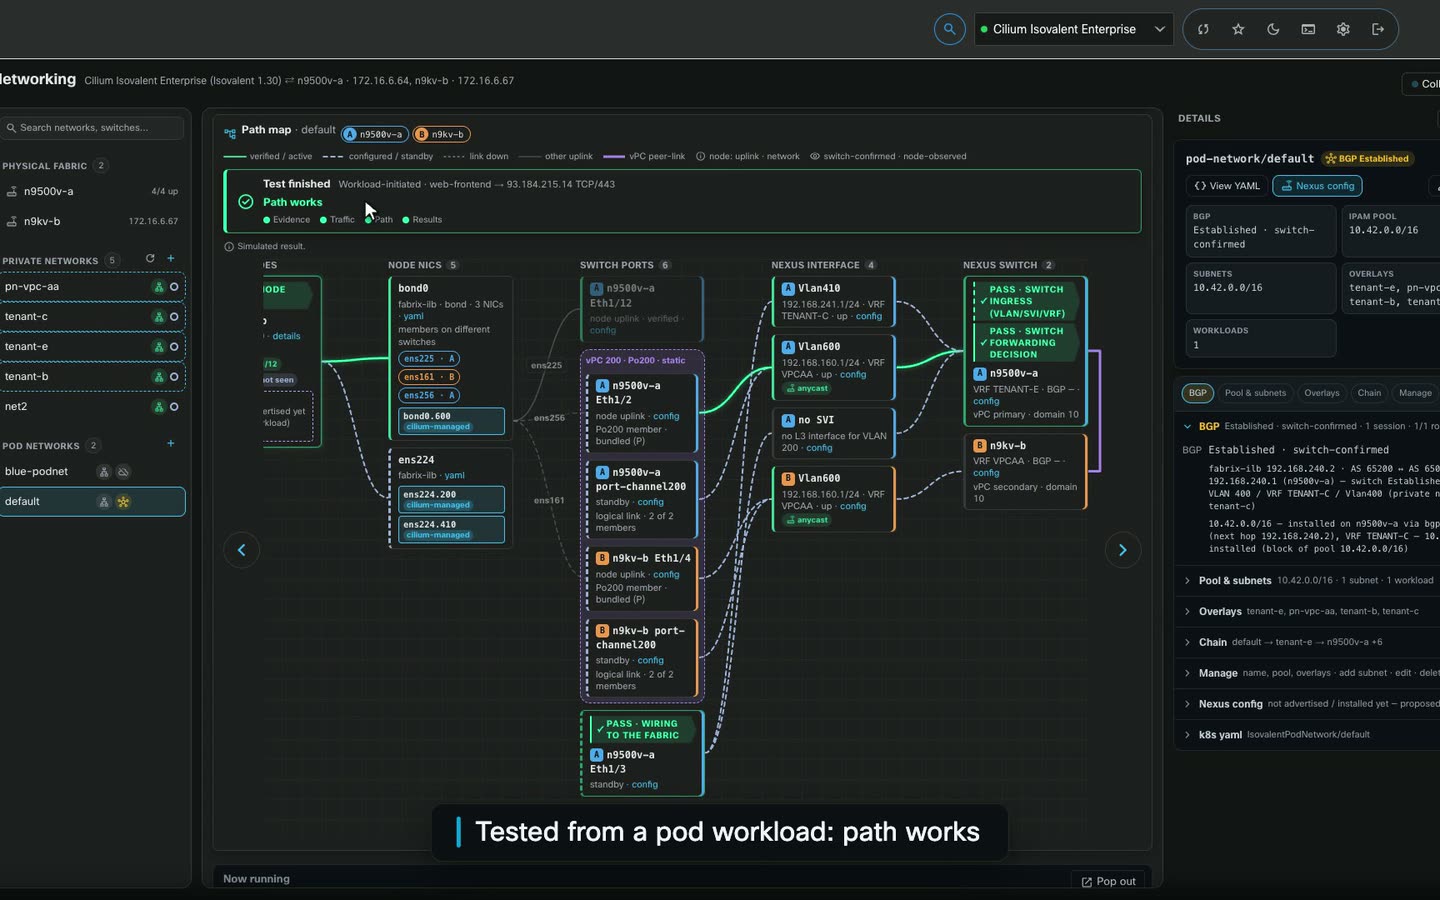
New Private Network (VLAN handoff or BGP EVPN)Trace path: workload β†’ node β†’ NIC β†’ switch portFaceplate Β· Port LED Β· Interface statisticsPropose switch config (diff + revert)
Screen recording of Fabrix Networking with a Nexus 9000: selecting private network blue and tracing a KubeVirt VM hop by hop through node and private network to the switch port, Nexus and fabric, flagging the hop that breaks
For you
Off-menu
Network TestProve connectivity hop by hop.
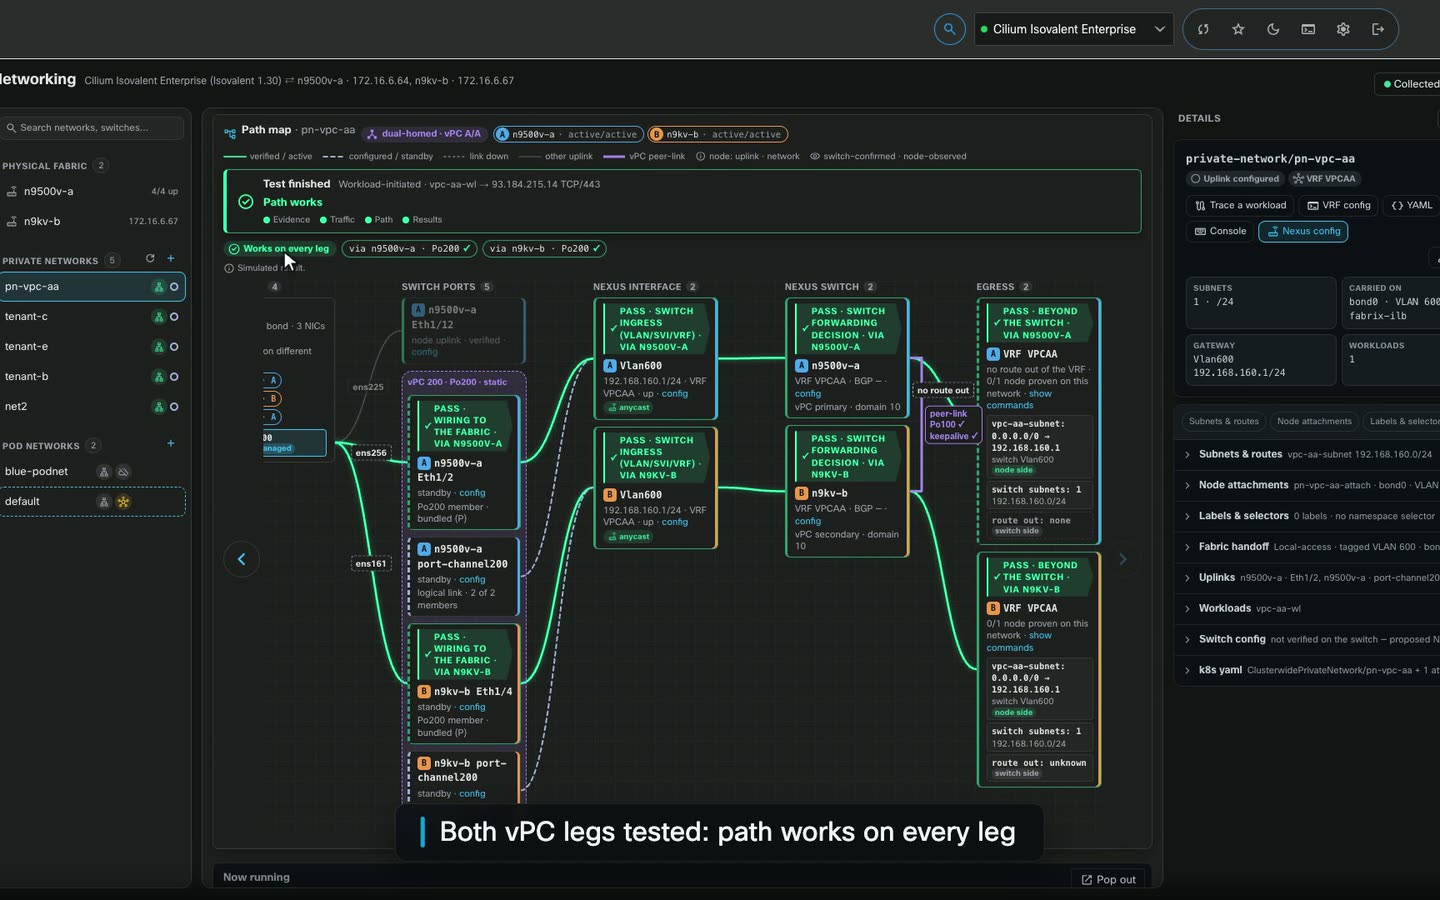
Observe / probe / AnalysisTCP Β· UDP Β· ICMPEvidence per hop
Screen recording of a Fabrix Network Test on a dual-homed private network: both vPC legs are tested and the path works on every leg
For you
Local
Load BalancerIsovalent load balancing with a live flow canvas.
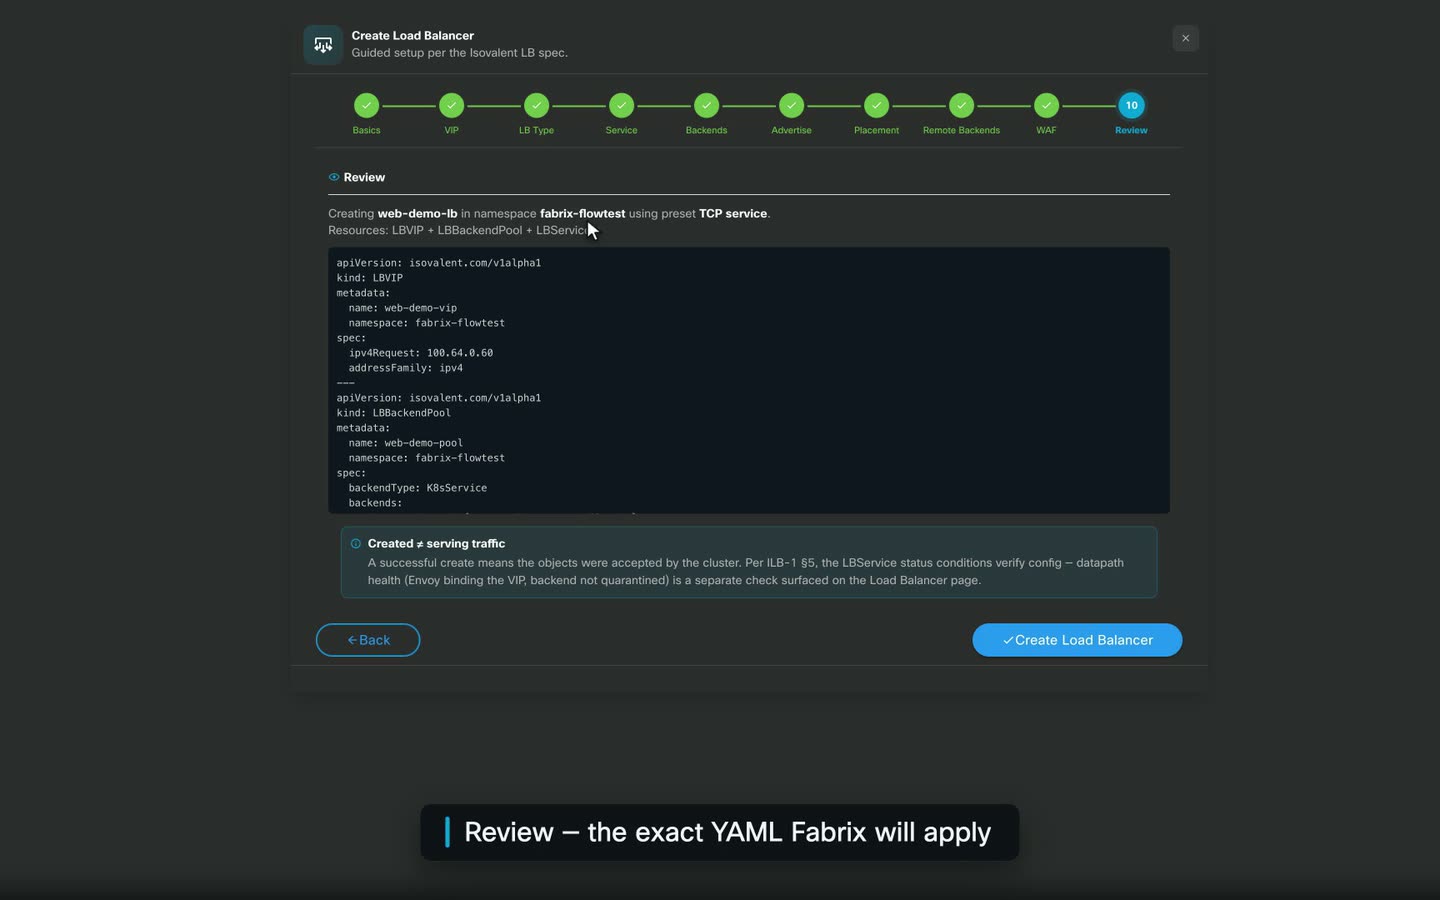
VIPs and poolsLive flow canvasBGP advertisement
Screen recording of the Fabrix Create Load Balancer wizard: the review step shows the exact YAML for the VIP, backend pool and service, then it is created and goes live
For you
Local
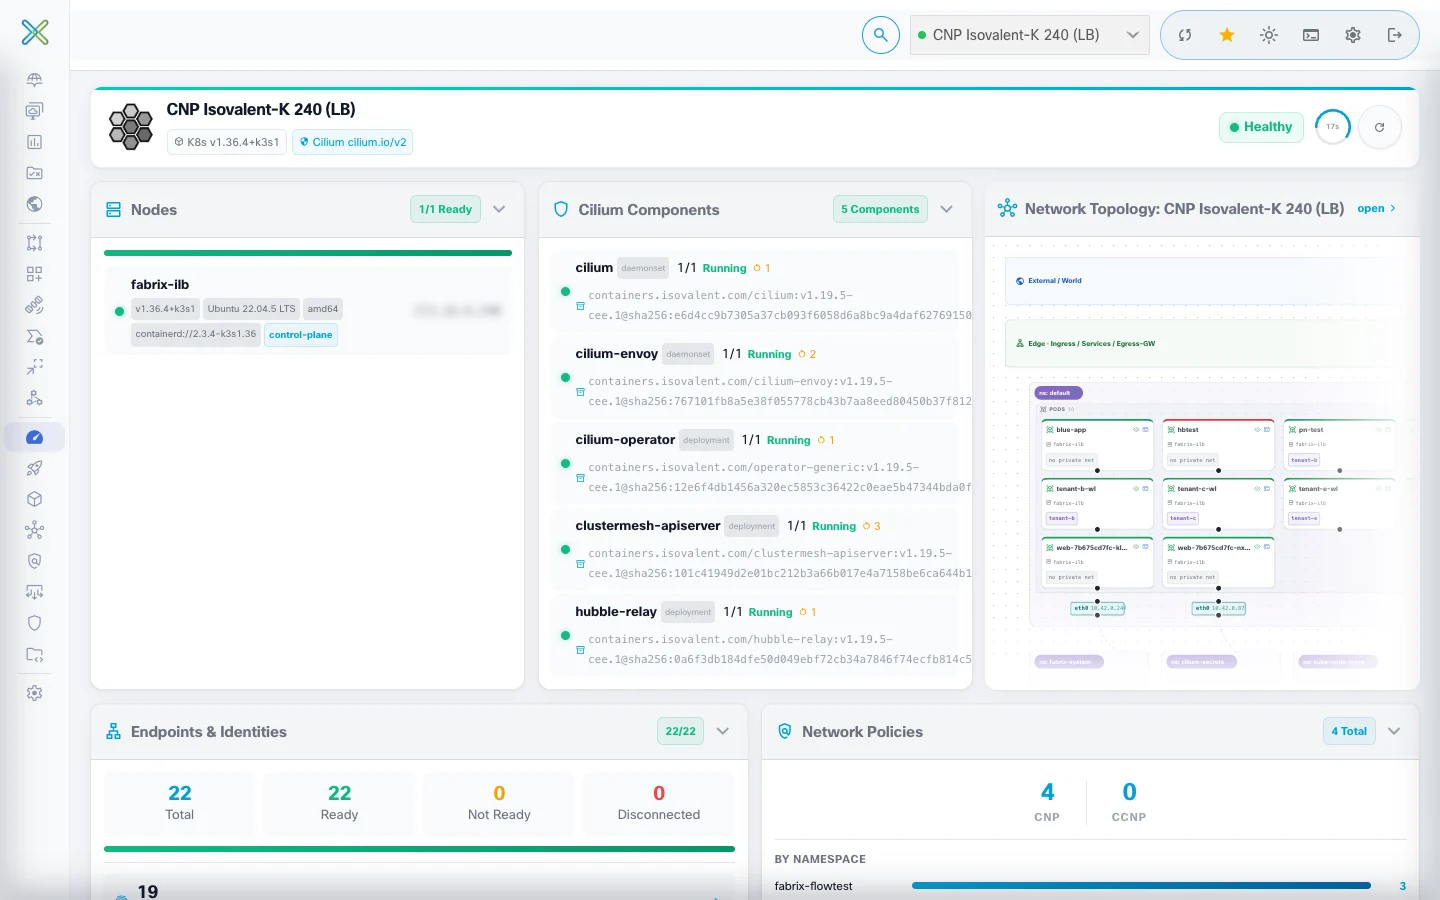
Cluster DashboardSingle-cluster health at a glance.
NodesCilium ComponentsEndpoints & IdentitiesDiscovered CRDs
Fabrix Cluster Dashboard for an Isovalent cluster: node readiness, Cilium components with their images and status, a network topology preview, endpoints and identities, and network policy counts
For you
Universal
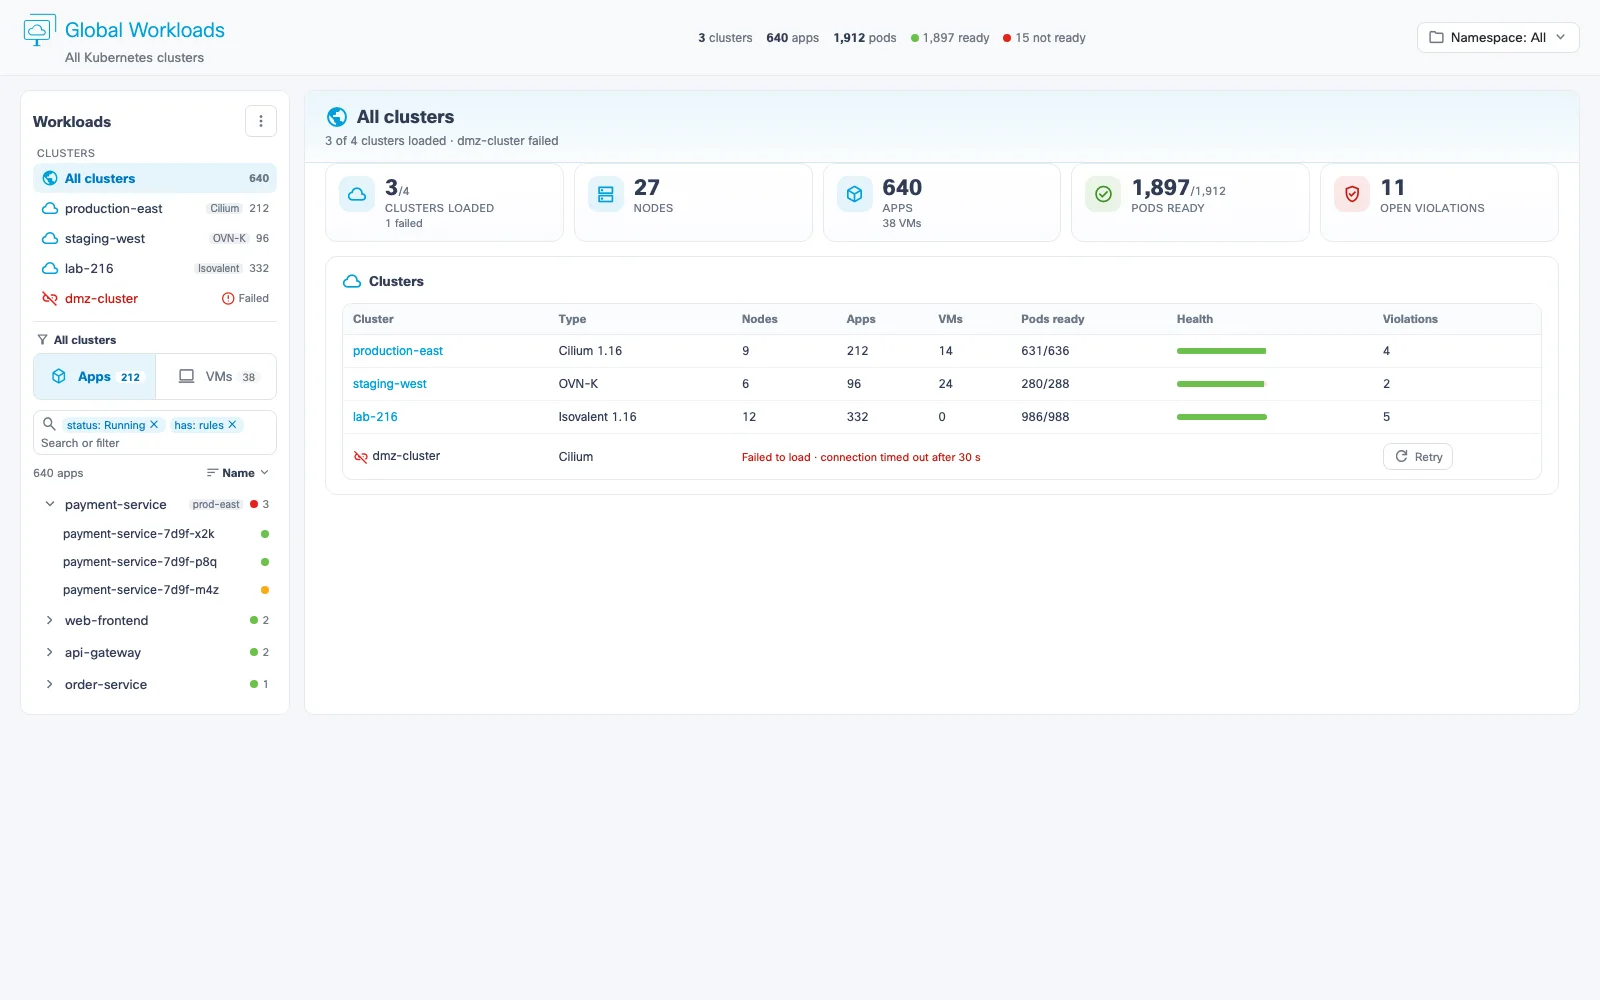
Global WorkloadsEvery cluster, namespace, pod and VM in one tree.
Cluster β†’ namespace β†’ pod / VM treeEndpoint detail: usage, policies, activity
Fabrix Global Workloads design preview: every cluster in one view with nodes, apps, pods ready and open violations, and a cluster that failed to load shown with a retry

Deep dive

Cluster, fabric and path, in one console.

  1. Fabric wiring Β· New Private Network

    Wire the cluster to the fabric, and build private networks in a wizard.

    A network tree and a fabric wiring canvas show the cluster against its top-of-rack switches and uplinks. The Isovalent "New Private Network" wizard does a server-side dry run before anything is created.

    • Fabric wiring canvas: cluster ↔ top-of-rack switches, uplinks
    • "Networks" and "Uplinks" tables
    • Wizard: subnets, gateway / VRF, VLAN handoff or BGP EVPN, node bond / NIC, "Cluster mesh"
    • Server-side dry run, then "Create in the cluster"
  2. Cisco Nexus Β· Arista EOS

    The switch, from the faceplate down to the running config.

    Nexus and Arista switches appear with a live faceplate and per-port detail. On Nexus, Fabrix proposes the switch config as a diff against what is running, with a plan you can revert.

    • "Fabric overview" and a faceplate with "Port LED"
    • Per-port VLAN drill-down and "Interface statistics" (live counters)
    • Running config read live, with secrets masked
    • Nexus: "Propose switch config" (diff against running config, download), "Fabric plan" with "Revert plan", vPC, MDT "Telemetry" listener
  3. Trace path Β· Network Test Β· Topology

    Answer "is it the network?" with evidence for every hop.

    Trace path follows a workload through the node and NIC to the exact switch port. Network Test proves the connection, and the Topology view stacks every layer down to the physical underlay.

    • "Trace path": workload β†’ node β†’ NIC β†’ switch port β†’ switch β†’ egress, with detail per hop
    • Network Test: Observe / probe / Analysis; TCP, UDP, ICMP; inbound, outbound or both
    • Evidence per path step
    • Topology layers: Pod Network, Private Network, VM Guest vNIC, Host NIC, "Physical Underlay"; live Hubble flows; KubeVirt VMs

Fine print

  • Works with Kubernetes, Cilium (Git), Cisco Nexus and Arista EOS datasources.
  • The New Private Network wizard is for Isovalent. Propose switch config, Fabric plan, vPC and MDT Telemetry are Nexus only.
  • Cluster Dashboard and Global Workloads are for the Cilium family; Load Balancer is Isovalent-only.

See it live

Trace a path from a pod to its switch port with us.